Interacting with the charts
Every chart in ProteoformTracker (MS1 charge-envelope overlays, MS2 fragment ladders, the fragment-isotope inspector, and the rMATS exon-alignment preview) shares the same interaction model. This page covers all of them once.
Zoom and pan
- Scroll/pinch directly on a chart to zoom, centered on the cursor.
- Drag to pan.
- The + / − / Reset buttons above each chart do the same zoom in/out/reset-to-full-view, for trackpad-free use.
- A live range readout next to the zoom buttons shows the current view (e.g. residue range and percent of total, or an m/z range and percent, depending on the chart's domain).
Your zoom/pan position is preserved across a re-render triggered by tweaking an unrelated input (e.g. adding a PTM to a different isoform) — it only resets to full-width when the underlying axis itself changes length (e.g. loading a different gene).
Hovering
MS1 charts
Once zoomed in enough that individual peaks are distinguishable (a hint reminds you when you haven't zoomed in enough yet), hover a peak to see its own m/z/charge/intensity plus how it relates to the nearest meaningful peak (≥1% relative intensity) from a different proteoform in the same chart — expressed in multiples of the instrument's own resolving-power FWHM at that m/z. See Resolving power & FWHM for what the ratio means.
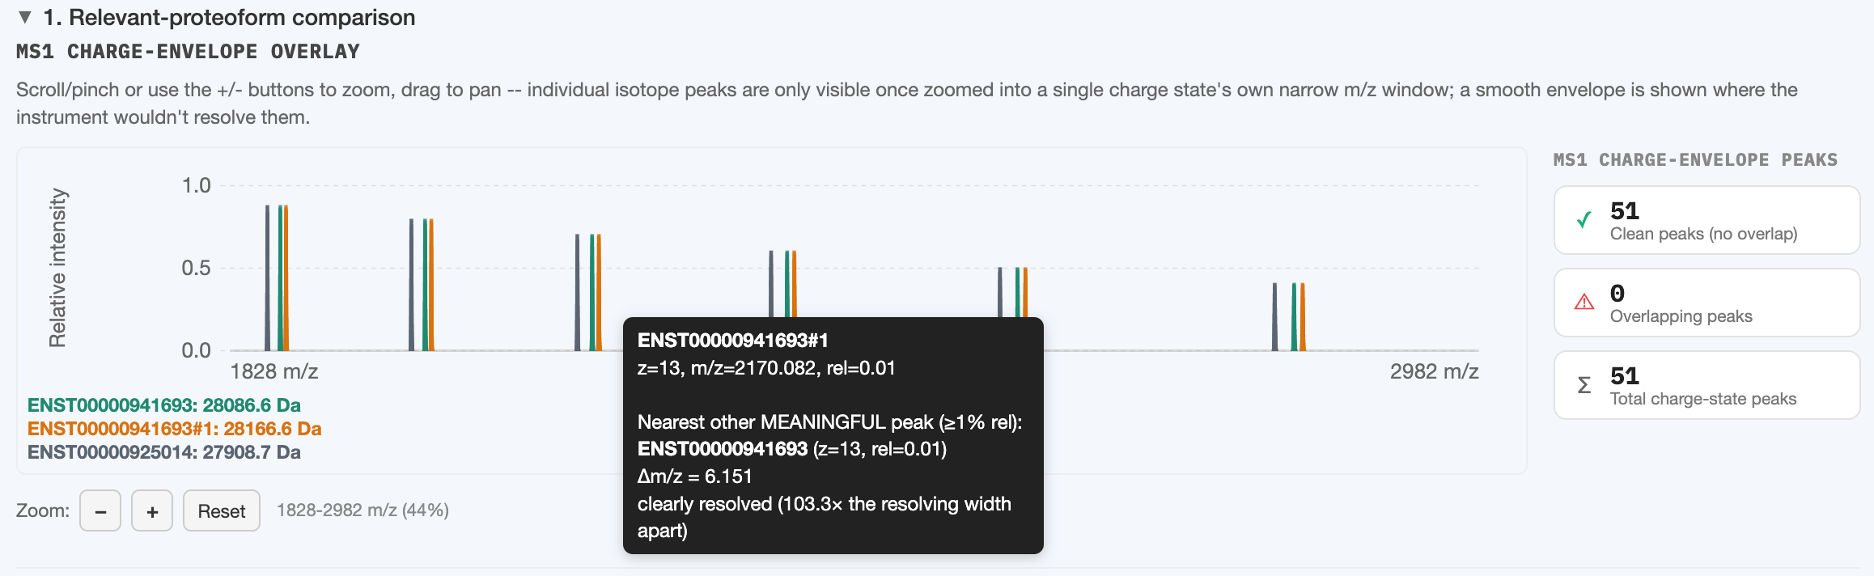
A clearly resolved case: two proteoforms' peaks here sit 103.3× the instrument's resolving width apart, so the hover tooltip reports them as cleanly separable rather than at risk of overlapping.
MS2 ladder
Hover a b/y tick (same zoom-in requirement) to see that bond's fragment mass, its tier, and its raw propensity score.
Clicking a fragment ion (MS2 ladder only)
Click a b/y tick to open the fragment-isotope inspector below the ladder: that one fragment ion's own predicted isotope pattern, computed on demand and overlaid across every other checked proteoform (or confounder) that has a qualifying fragment at the same aligned axis position. This is deliberately click-to-compute rather than always-on — see Section 1 for why.
A fragment only "qualifies" for this inspector if its propensity score clears the current scoring mode's isotope-computation gate — if you click a bond with no qualifying proteoform, the label explains why instead of showing an empty chart.
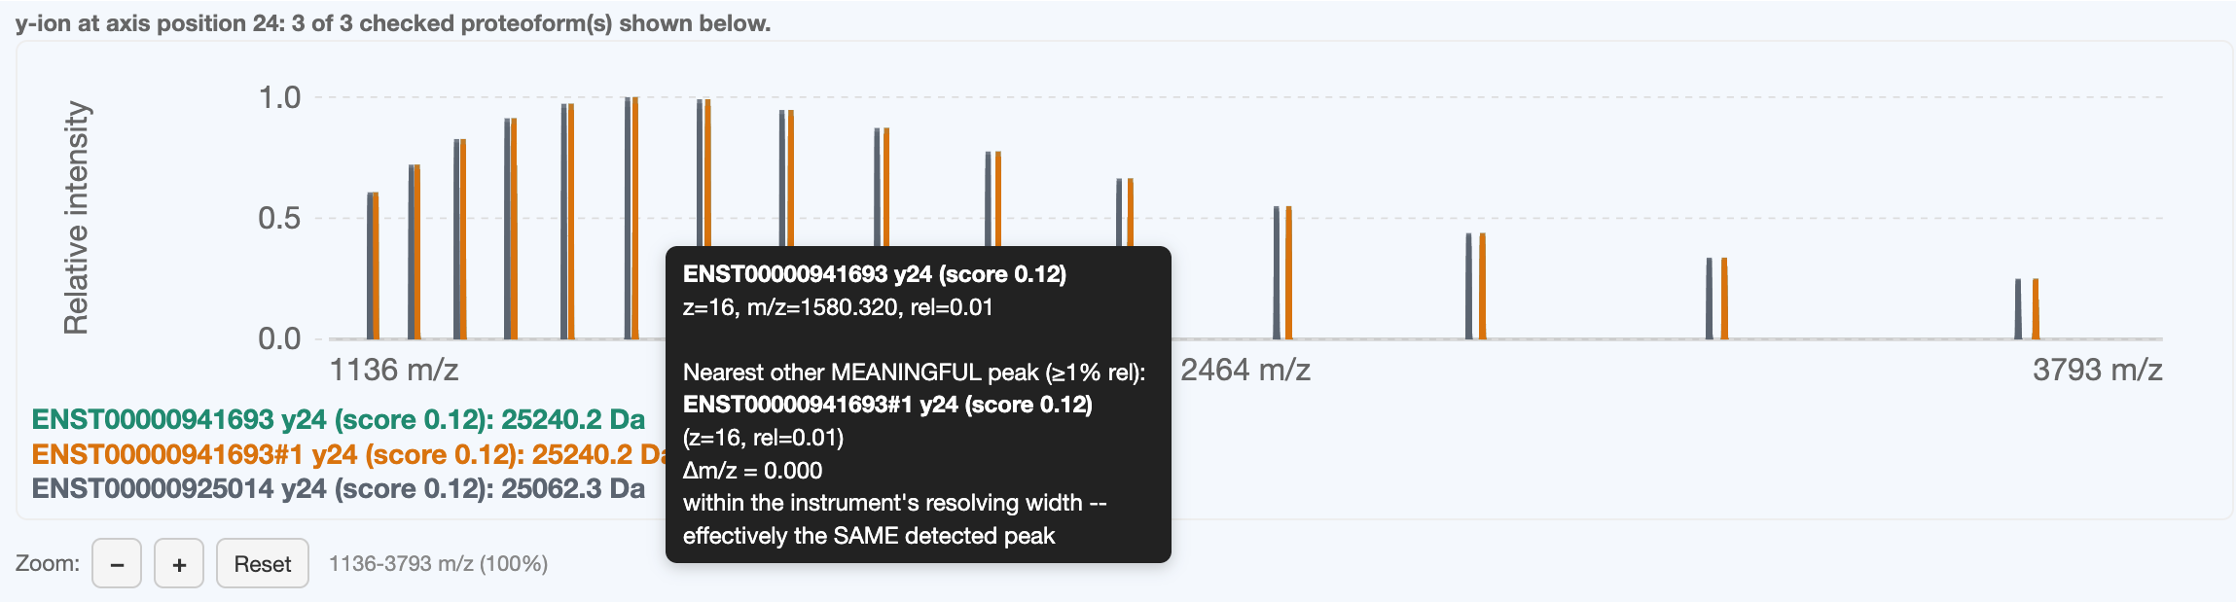
The same resolved-vs-overlapping question the MS1 chart answers for the intact protein, answered here for one fragment ion at a time — the same resolving-power model underlies both. This is the opposite case from the MS1 example above: two proteoforms' y24 ions coincide exactly (Δm/z = 0.000) and are reported as effectively the same detected peak.
Fragment filter
Above every MS2 ladder, three buttons (All fragments / Elevated / High) restrict which bonds are drawn to those clearing a given propensity tier. Two things update live when you change this:
- The "N of M bonds shown" readout
- The per-row unique/partial/common badge counts next to each proteoform's title — these are recomputed from only the currently-visible bonds every time you change the filter, not a static number from when the analysis first ran
The isoform/gene sequence popover
In the isoform catalog (not a results chart, but the same popover mechanism), hover a transcript ID to see its full sequence with residue-position ruler numbers — useful for writing a PTM spec without counting residues by eye. Unlike the chart tooltips, this popover accepts mouse-over itself (so you can move into it to read/select/copy the sequence) and stays open briefly after you leave the trigger.