Section 1: Relevant-proteoform comparison
Shows the full MS1 + MS2 comparison across every proteoform you checked — the isoforms/PTM combinations from Option 1, a novel sequence from Option 2, or matched transcripts from Option 3. Populates automatically after Run analysis.
MS1 charge-envelope overlay
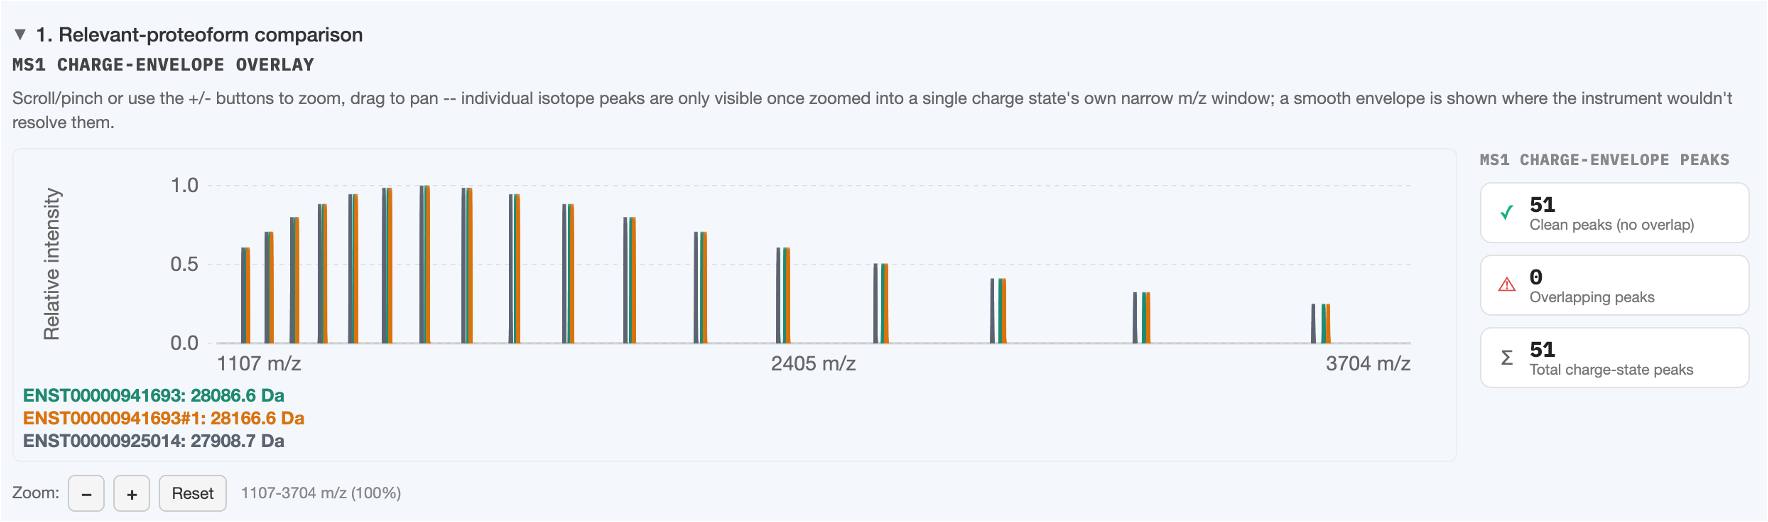
Every checked proteoform's predicted charge-state envelope, overlaid on one shared m/z axis — see Charge-state envelopes for what's actually being predicted (real isotope combs where resolved, smooth curves where not) and how to read a hover tooltip.
The stats panel beside the chart aggregates pairwise peak-collision checks across the whole set:
- Clean peaks — no overlap with any other checked proteoform's peak
- Overlapping peaks — within the instrument's resolving-power safety margin of another peak
- Total charge-state peaks
Only shown with 2+ proteoforms checked (nothing to compare a single proteoform against).
MS2 fragment ladder
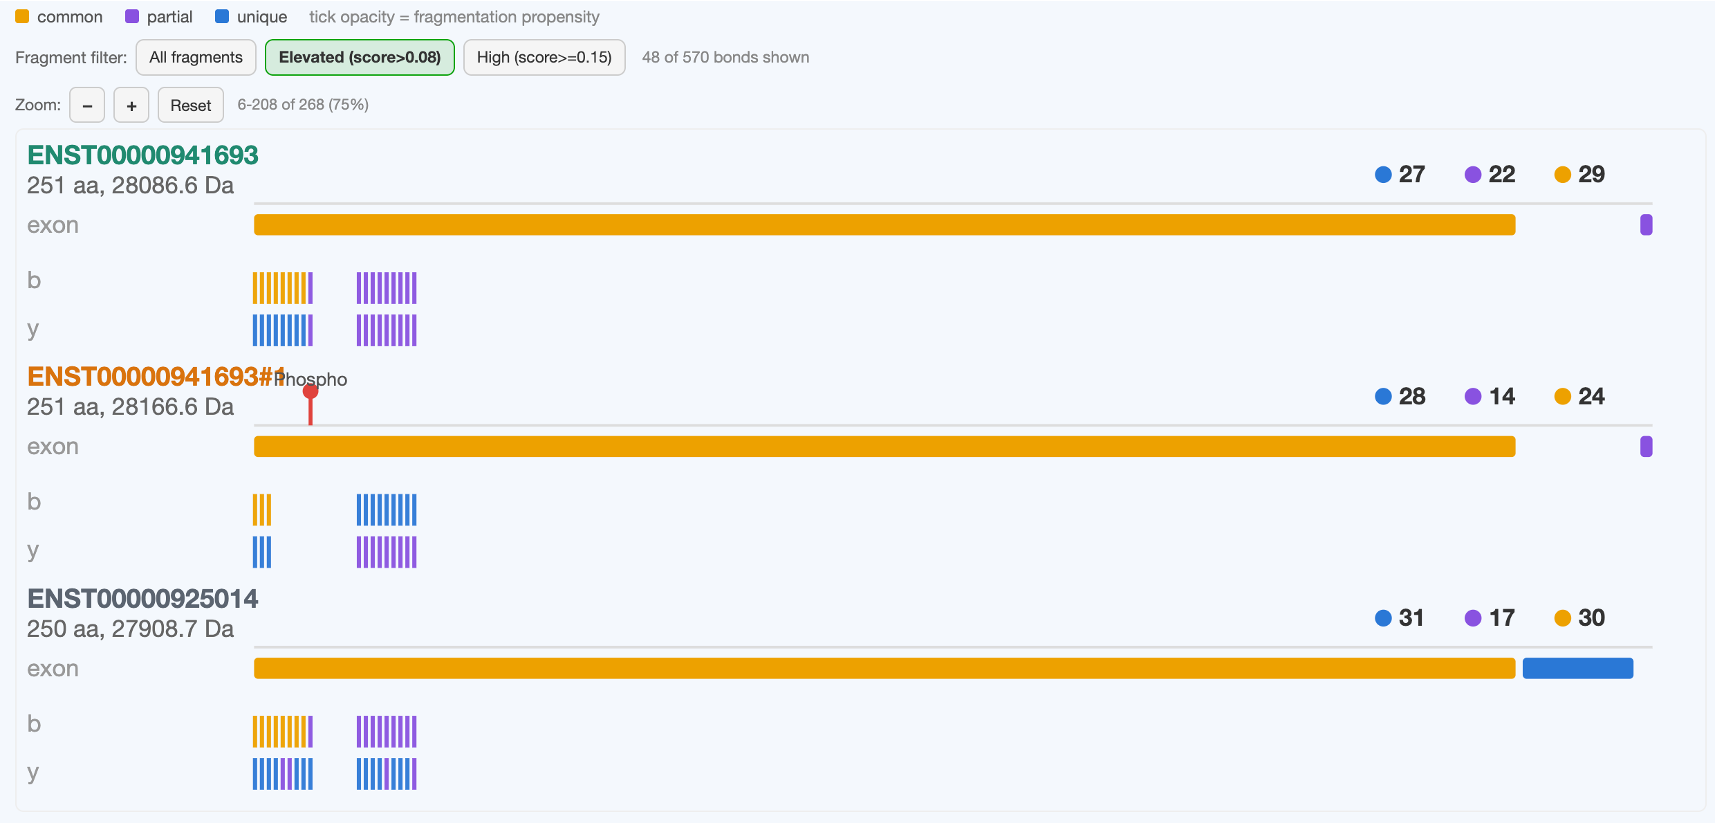
One row per checked proteoform, aligned on a shared exon axis so proteoforms from the same gene line up by genomic position rather than raw residue count — a 700-residue and a 743-residue isoform of the same gene still show their shared exons at the same horizontal position.
Each row has, top to bottom:
- Title — proteoform label, length, mass, and (to the right) live unique/partial/common badge counts — see Tier colors
- Any PTM markers (red pin + label) at their real residue position
- exon track — tiered by real genomic exon-boundary comparison against the other rows
- b and y ion tracks — tick color = tier, tick opacity = fragmentation propensity score
Fragment filter
Buttons above the ladder (All fragments / Elevated / High) restrict which bonds are drawn, using whichever scoring mode is active. The per-row badge counts and the "N of M bonds shown" readout both update live when you change this.
Inspecting one fragment's own isotope pattern
Click any b/y tick (once zoomed in enough to hover it individually) to see that specific fragment ion's own predicted isotope peaks, overlaid across every checked proteoform that has a qualifying fragment at the same aligned position — the same resolved-vs-overlapping question the MS1 chart answers for the intact protein, answered here for one fragment ion at a time. This is computed on demand (not precomputed for the whole ladder) since a long proteoform can have 100+ qualifying bonds and eagerly computing every one's isotope pattern would make Run analysis far slower for no benefit until you actually click something.
See Interacting with the charts for zoom/pan/hover mechanics common to every chart in the app.